The sale department requires reports that contain the number of sales transactions.
The COUNTROWS function counts the number of rows in the specified table, or in a table defined by an expression.
Reference:
https://docs.microsoft.com/en-us/dax/countrows-function-dax
Topic 3, Northwind Traders
Overview
This is a case study. Case studies are not timed separately. You can use as much exam time as you would like to complete each case. However, there may be additional case studies and sections on this exam. You must manage your time to ensure that you are able to complete all question included on this exam in the time provided.
To answer the questions included in a case study, you will need to reference information that is provided in the case study. Case studies might contain exhibits and other resources that provide more information about the scenario that is described in the case study. Each question is independent of the other question on this case study.
At the end of this case study, a review screen will appear. This screen allows you to review your answers and to make changes before you move to the next section of the exam. After you begin a new section, you cannot return to this section.
To start the case study
To display the first question on this case study, click the Next button. Use the buttons in the left pane to explore the content of the case study before you answer the questions. Clicking these buttons displays information such as business requirements, existing environment, and problem statements. If the case study has an All Information tab, note that the information displayed is identical to the information displayed on the subsequent tabs. When you are ready to answer a question, click the Question button to return to the question.
Overview. General Overview
Northwind Traders is a specialty food import company.
The company recently implemented Power BI to better understand its top customers, products, and suppliers.
Overview. Business Issues
The sales department relies on the IT department to generate reports in Microsoft SQL Server Reporting Services (SSRS). The IT department takes too long to generate the reports and often misunderstands the report requirements.
Existing Environment. Data Sources
Northwind Traders uses the data sources shown in the following table.

Source2 is exported daily from a third-party system and stored in Microsoft SharePoint Online.
Existing Environment. Customer Worksheet
Source2 contains a single worksheet named Customer Details. The first 11 rows of the worksheet are shown in the following table.
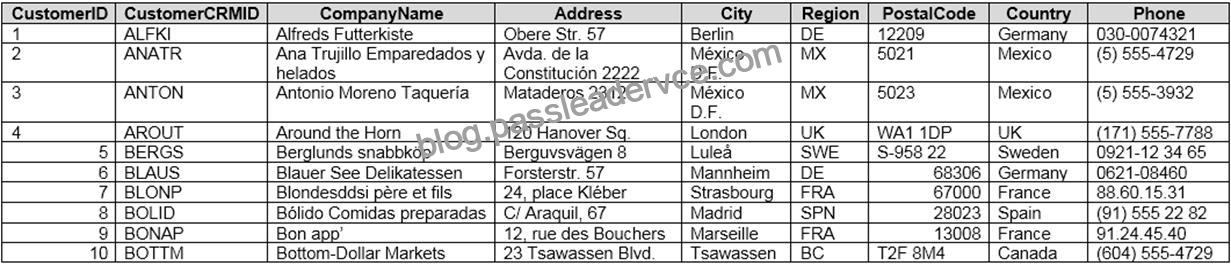
All the fields in Source2 are mandatory.
The Address column in Customer Details is the billing address, which can differ from the shipping address.
Existing Environment. Azure SQL Database
Source1 contains the following table:
Orders
Products
Suppliers
Categories
Order Details
Sales Employees
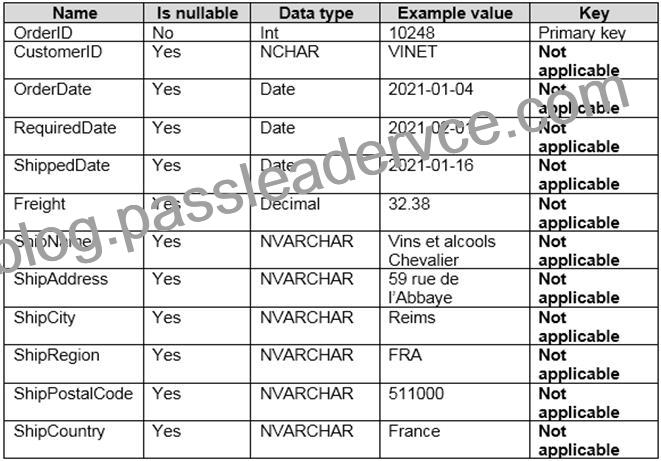
The Orders table contains the following columns.
The Order Details table contains the following columns.
The address in the Orders table is the shipping address, which can differ from the billing address.
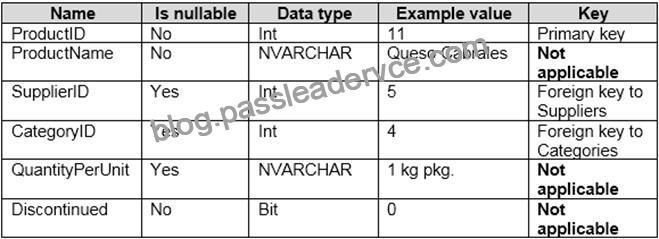
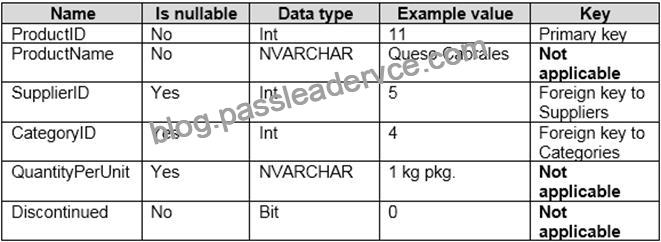
The Products table contains the following columns.
The Categories table contains the following columns.

The Suppliers table contains the following columns.
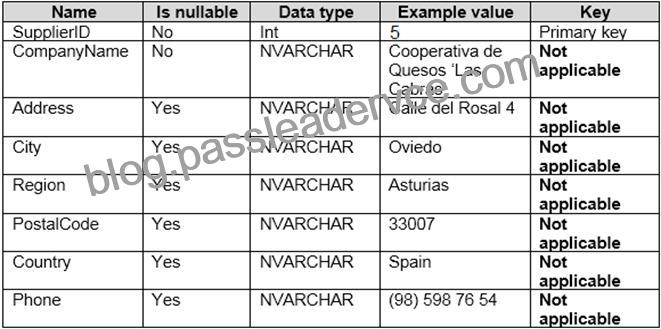
The Sales Employees table contains the following columns.
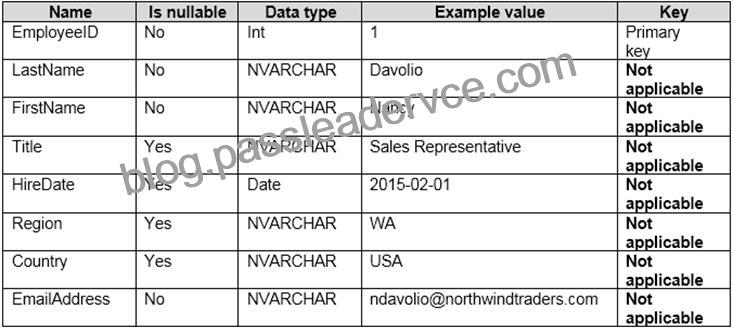
Each employee in the Sales Employees table is assigned to one sales region. Multiple employees can be assigned to each region.
Requirements. Report Requirements
Northwind Traders requires the following reports:
Top Products
Top Customers
On-Time Shipping
The Top Customers report will show the top 20 customers based on the highest sales amounts in a selected order month or quarter, product category, and sales region.
The Top Products report will show the top 20 products based on the highest sales amounts sold in a selected order month or quarter, sales region, and product category. The report must also show which suppliers provide the top products.
The On-Time Shipping report will show the following metrics for a selected shipping month or quarter:
The percentage of orders that were shipped late by country and shipping region Customers that had multiple late shipments during the last quarter Northwind Traders defines late orders as those shipped after the required shipping date.
The warehouse shipping department must be notified if the percentage of late orders within the current month exceeds 5%.
The reports must show historical data for the current calendar year and the last three calendar years.
Requirements. Technical Requirements
Northwind Traders identifies the following technical requirements:
A single dataset must support all three reports.
The reports must be stored in a single Power BI workspace.
Report data must be current as of 7 AM Pacific Time each day.
The reports must provide fast response times when users interact with a visualization.
The data model must minimize the size of the dataset as much as possible, while meeting the report requirements and the technical requirements.
Requirements. Security Requirements
Access to the reports must be granted to Azure Active Directory (Azure AD) security groups only. An Azure AD security group exists for each department.
The sales department must be able to perform the following tasks in Power BI:
Create, edit, and delete content in the reports.
Manage permissions for workspaces, datasets, and report.
Publish, unpublish, update, and change the permissions for an app.
Assign Azure AD groups role-based access to the reports workspace.
Users in the sales department must be able to access only the data of the sales region to which they are assigned in the Sales Employees table.
Power BI has the following row-level security (RLS) Table filter DAX expression for the Sales Employees table.
[EmailAddress] = USERNAME()
RLS will be applied only to the sales department users. Users in all other departments must be able to view all the data.


